This post covers an effective strategy that can reduce Snowflake cost by 60% even with 40% more query volume and more use cases supported. We also explain the technical reasons why these tactics work better than the conventional approaches.
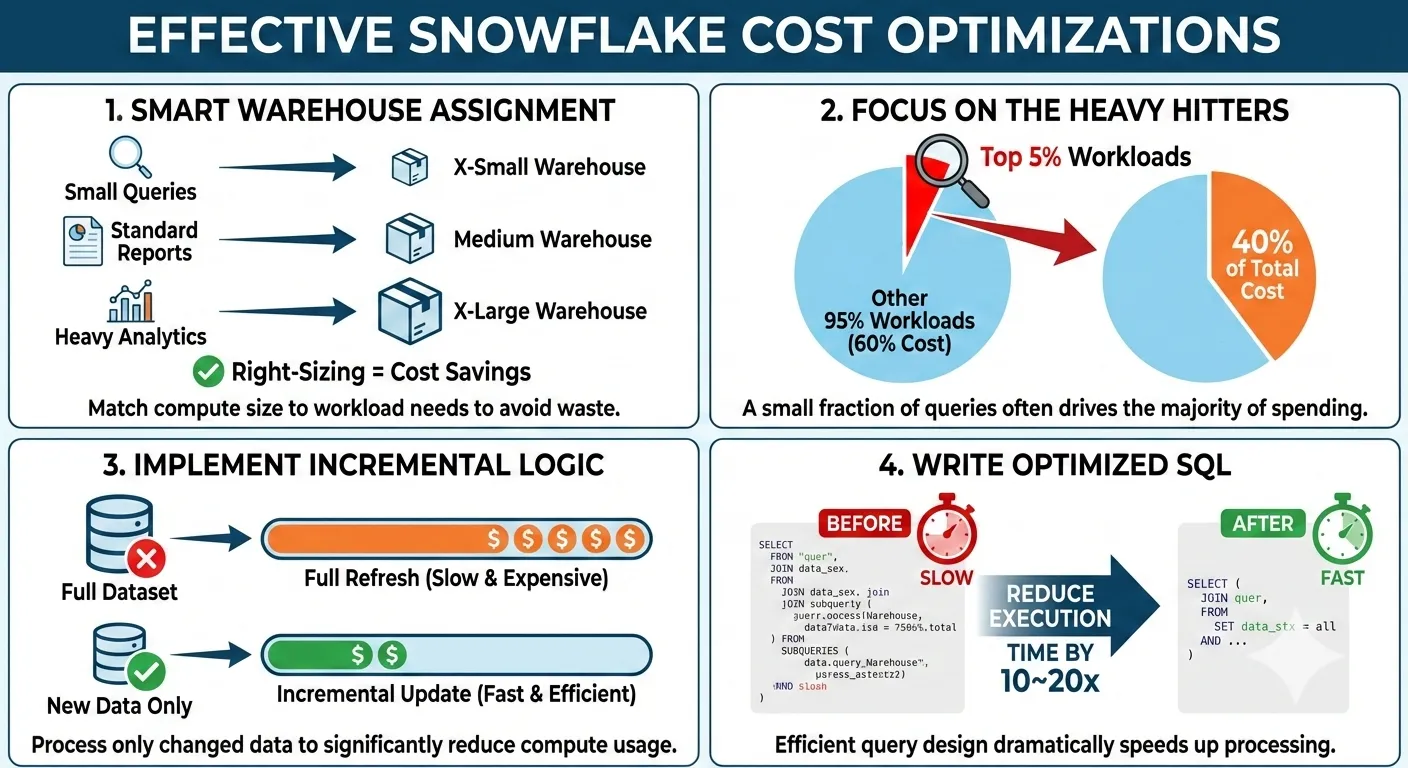
Table of contents
- Cost Heatmap
- 1. Virtual Warehouse
- 2. Highly-skewed workload
- 3. Refactor Data Model and SQL
- 4. Migrate to Other Engines
- 5. Storage Cost Reduction
- Summary
Cost Heatmap
| Area | Suboptimal Symptom | Why | |
|---|---|---|---|
| 1 | Allocation of virtual warehouse | 2XL/3XL/… cost a lot more but ‘small’ queries can prevent the cluster from idling | Snowflake tends to spin up new cluster promptly/aggressively; guardrails of query timeout, concurrency level, … |
| 2 | Highly-skewed workload | top 5% of jobs contribute to more than 40% of costs | It is far more important to deep dive into the top jobs and fix their problems instead of chasing a one-size-fits-all tricks to save 1% from each job |
| 3 | Easy-to-write-but-expensive-to-execute | Developers can write a lot of suboptimal pipelines and bad BI queries | SQL craftsmanship is 1% linter but 50% content understanding + 49% programming skills |
| 4 | Migrate heavy workloads to alternative engines | Snowflake is designed for SQL-first convenience, but other challengers has their unique strength for different type of workloads | With Iceberg, offloading ‘certain’ workloads to DuckDB, Dask, Polars, Feldera has become possible |
| 5 | Storage | Too many ‘cloned’ copies; daily full snapshot vs incremetnal; Extra bytes of fail-safe FDN table | For the huge immutable historical partitions and tables, Iceberg can cut up to 30% cost due to the discount from cloud provider |
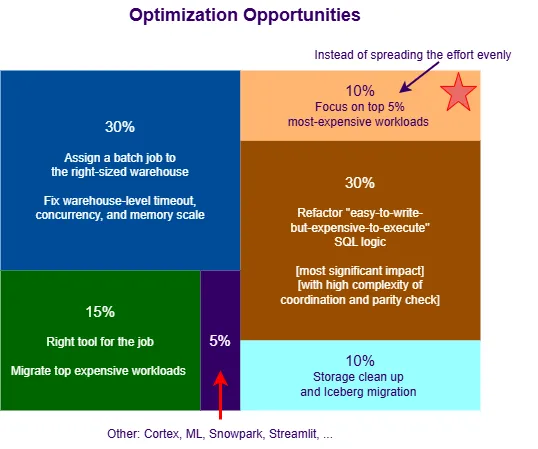
Every company will have its own cost distribution, yet in general, [1] is easy to detect and 30% of
waste lies here;
[2] can visually show how skewed/concentrated the most expensive jobs, so that teams
can stay focused on the ‘celebrities’ and are willing to take actions of refactor or even [4];
[3] arguably is the fundamental cause of cost spiral, it is super important to differentiate it
from the natural/health growth; roughly 50% of waste comes from this category;
[4] some patterns don’t fit well into Snowflake, but we may blindly squeeze everything into a single basket. Once we identify such cases, we should find the right engine for the job;
[5] though storage size seems huge, about 10% can be considered as wasteful cost;
Everything else including Snowpark, Openflow, Cortex, Search, … can provide ~10% of cost optimization opportunity.
1. Virtual Warehouse
Snowflake probably has the most usable “decoupled/disaggregated compute-storage” architecture: all the compute nodes (cluster) are pre-warmed and can start serving queries with minimal delay, switching to different sized virtual warehouse can be easily and dynamically done within a single session (this flexibility is still not available for most competitors).
Each cluster can actively execute multiple queries. However, it is still a blackbox w.r.t. how Snowflake estimates the query cost:
- If an incoming query is estimated small enough to run alongside other queries in an existing
cluster. This is limited by
MAX_CONCURRENCY_LEVEL. - If the incoming query seems heavy, Snowflake will either spin up a new cluster, or hold this query in a queue.
- For “transformation-heavy” CTAS queries, we often observe that Snowflake spins up a new cluster
before its
MAX_CONCURRENCY_LEVEL(6 or 8) is reached.
- 6XL is a fleet of 512 nodes of (likely)
c7g.2xlarge/c5d.2xlargewith total 8TB RAM.- Snowpark-optimized 4XL has 128 nodes of
r5d.8xlargewith 32 TB of RAM.- 4XL has 128 nodes of
c7g.2xlarge/c5d.2xlargewith 2TB RAM.
Let’s assume each Snowflake credit = $3/hour, if we can get 40% EC2 discount from AWS, the high-memory cluster has 3X markup while the normal cluster has 13X markup for the Snowflake software. This is why a big portion (70~80%) of cost goes into the EC2 behind the clusters. We need to understand the Snowflake behavior & caveat in order to improve cost efficiency.
Warehouse Parameters
Don’t use the default/initial warehouse parameters because they are all too loose, which lead to a lot of waste ^_^
| Parameter | COPY INTO | Batch Transformation | BI, ad-hoc and AI Agent |
|---|---|---|---|
| STATEMENT_TIMEOUT_IN_SECONDS | Keep time <1 hour | Keep timeout <2 hours for XL or bigger warehouse | Use Medium or smaller warehouse with 20 minutes timeout |
| MAX_CONCURRENCY_LEVEL | Reduce it to 4~5 | Reduce it to 2~3 for shuffle-heavy or memory-hungry warehouse | 8~16 |
| AUTO_SUSPEND | 1 minute | 2 minutes | 3 minutes |
| SCALING_POLICY | STANDARD | ECONOMY for shuffle-heavy or memory-hungery warehouse | STANDARD |
| MAX_CLUSTER_COUNT | Reduce it to 4~6 | Reduce it to 2~3 for 3XL or bigger warehouse | Keep it below 20 |
COPY INTOworkloads are very CPU-intensive for SerDe, and they don’t often reuse cache; Gen2 warehouse may suit better.Batch Transformation(a.k.a. ELT or CTAS) workloads have a wide range of shapes, but those memory-hungry queries often run for a very long time, retry several times, and drag the warehouse costs very high. If a given query statement runs longer than 90 minutes in 3XL, this is already a pretty strong indicator that this query needs a serious refactor.bytes_spilled_to_local_storageis a must-check metric in QUERY_HISOTRY. If this is very big (especially bigger thanbytes_scannedalready), that means a lot of spills have happened due to insufficient RAM for shuffle. Since each cluster can have multiple queries concurrently, it is hard to track the runtime resource consumption at the cluster level (unless we create a support ticket with the QUERY_ID).- Since Snowpark-Optimized warehouse offers 16X RAM but only 1.5X cost, this is a very effective way to route the jobs with high spills to a Snowpark-optimized warehouse. We also need to set a very low concurrency for such a warehouse in order to reduce the competition of RAM. We call such warehouse “high-memory, low-concurrency, slow-scale-out”. If a query runs into spills, it is at least 10X slower than the same query without spills, therefore it is wise to let the query be queued for 30 more minutes and then run/finish quickly once sufficient RAM is available.
- 90% of long-running queries have bad spills, but using high-memory warehouse is just the quick remedy. The true optimization is to understand the reason of high spills, such as explosion after join, data skew, lack of incremental logic, crazy window function, too many count distinct, … and then refactor the SQL and data model, which can yield 10~30X performance improvement with much lower RAM demands. Again, high spill is a quite clear signal of suboptimal code logic, don’t just leave such bad codes alone by simply throwing high-memory warehouse into the problem.
BI, ad-hoc and AI Agentcan generate a large amount of queries, which are supposed to be light-weight compared with batch jobs, andMediumwarehouse should be able to handle the workloads. However, due to lack of practical data modeling enforcement, many bad queries are generated here.- Full-table scan (against a huge table) is the most obvious symptom. Such bad queries hog both
RAM and CPU in the cluster, then Snowflake put a lot of other queries in queue (for 10~60 minutes).
- Of course, the user experience will be bad, then people request more resource (either bigger
warehouse size or max_cluster_count) allocation, but the bad queries keep coming back and choking
the queue because BI and AI Agent can
effortlesslygenerate such bad queries hundred/thousand times. - BI and AI Agent, currently, don’t have the capability of estimating the query cost based on the historical evidence and then routing it to a different virtual warehouse. So we have to constantly detect such “bad” queries and trace them back to the report/model/view/template in the BI/AI scope. Then we have to ban such artifacts or restructure the data model by pointing the queries to pre-filtered and pre-aggregated tables (maintained via scheduled pipelines) instead.
- Of course, the user experience will be bad, then people request more resource (either bigger
warehouse size or max_cluster_count) allocation, but the bad queries keep coming back and choking
the queue because BI and AI Agent can
- Complex join and aggregate on-the-fly is the second problem. BI and AI Agent are popular interfaces to data lake, but they often amplify the inefficient and silly queries because they don’t have sufficient/concrete context about “raw => derived => aggregated” or “bronze => silver => gold”, so BI, MCP and agent layer is currently too thin to choose or construct the right data model to meet the cost/performance bar. We have to build a better context graph and BI/AI engines need to consult the context graph first.
- Even though batch jobs are still the biggest cost of Snowflake, AI/BI-geneerated queries with expensive scans against big raw tables, with many joins, and with 15~20 CTEs are pushing the rising spot of cost. If we see more than 10 clusters staying active for a AI/BI virtual warehouse, it is going to be worse.
- Full-table scan (against a huge table) is the most obvious symptom. Such bad queries hog both
RAM and CPU in the cluster, then Snowflake put a lot of other queries in queue (for 10~60 minutes).
Route Query to the Right Warehouse
In short, keeping too many big (XL and above) clusters live can quick increase the cost.
Dynamically changing the size of a virtual warehouse is not effective for batch jobs. It is almost impossible to predict when the heavy/expensive queries will come. After we detect a particular running query as expensive, this query won’t run in a bigger warehouse unless we kill the job and rerun it in a bigger warehouse or we let Query Acceleration Service automatically increase the parallelism of workers with more EC2 resources.
Implementing an effective lineage instrumentation is a key to leverage the QUERY_HISTORY and effectively rank a batch job as S/M/L/XL/…/High-Memory. A practical guide is to:
- Create a derived/enhanced QUERY_HISTORY table to augment ACCESS_HISTORY together. This table should
be clustered by
START_TIME::DATE, QUERY_TYPEfor a better analytical performance. We can also enhance QUERY_TAG in this table. - Inject
{system:x, workflow:y, job:z, batch:t, target_tabel:f, backfill:k}into QUERY_TAG via the Snowflake connection/connector/provider in an orchestrator if we can customize the code/lib.
Later we can use TRY_PARSE_JSON() to slice and dice the history by the relevant dimensions - Parse the last line of lineage comment from SQL statement (generated by AI/BI/Notebook, such as Looker, Hex, and dbt) and store it into QUERY_TAG as JSON
- Aggregate cost from the query execution level by the dimensions in QUERY_TAG is the most instrumental step of the actionable cost attribution
The orchestrator will issue USE WAREHOUSE <determined_by_history> to route multiple SQL queries of
a given job or report to an appropriate warehouse. The main purpose is to:
- Prevent small queries from keeping the L/XL/… warehouse active
- Use High-memory and Low-concurrency warehouse for queries with expensive shuffle (spill)
⚠️ Please keep in mind that running 5 expensive queries one-by-one in a Snowpark-optimized warehouse can usually finish earlier than executing all 5 simultaneously - Due to the 35% price overhead of Gen2 warehouse, only use it for CPU-intensive jobs. Most long-running queries are caused by OOM, so [2] works out much better than Gen2
- Override a given backfill job with a larger warehouse for a few hours and then go back to the default warehouse assignment
This optimization does not require SQL changes by the developers, but it can reduce up to 30% compute cost of Snowflake.
2. Highly-skewed workload
After we apply lineage tracking trick to QUERY_TAG, it is possible to attribute the costs to specific business contexts which are represented by the orchestrator-level (high-level) names. Now we can see:
Top 5% of jobs contribute to more than 40% of costs.
The 10% of heavy workloads that tend to drive 80% of costs, engineering efforts, and complaints.
If we only change the job cron schedule or warehouse assignment, leverage linter to fix SQL, rely on AI review for the SQL statement to detect the bad patterns, then the result won’t be visible for these top workloads.
Unless we can deprecate a lot of jobs from the other 90% pool, it is not effective to chase a one-size-fits-all magic to optimize the other 90%. We should absolutely focus on the top 10% with serious effort of:
- Rewrite the pipeline to incremental and corresponding backfill logic.
- Identity the most expensive sub query or CTE which can be refactored as a reusable derived table.
- Learn the SQL best practice (in the next section) to mitigate the “significant” bad patterns.
- Migrate to a different engine to better express the transformation logic and execute with efficiency.
Focusing on the right workloads is critical for cost management especially we have limited engineering resources.
3. Refactor Data Model and SQL
Data modeling is particularly very important in terms of reusability, quality and maintainability
even in the era of AI because of data lake is the layer to integrate data silos, reconstruct the
“big” picture, materialize for frequently-used analytical query patterns, explore big data. More engineering
discipline and semantic context are required to counter the tons of discardable datasets (and pipelines)
created by “vibe codings”, because too many similar yet uncertified tables will simply confuse
nl2sql agents and waste a lot of resources to maintain. Canonical (or unified) schema should aim
at 70% of use cases with clearly-defined granularity, roll-up hierarchy, and audit/trace metadata.
The other 30% use cases should have significantly less frequency/popularity.
Certain tools are needed to facilitate the process to analyze query shapes and identify the “reusable” datasets from the composition of a few sub queries or CTE(s). GET_QUERY_OPERATOR_STATS is a fantastic function which helps us gather the stats and predicates, if we build an operational metadata table which accumulates all the query profiles which run for longer than ??? seconds, then we can effectively use ML/AI to identify very interesting clues to create and evolve the reusable materialized views or derived tables which can power & accelerate many downstream pipelines and queries. In addition, these MV/table(s) can provide a lot of data quality and evaluation values for agents and RLs.
For all the AP SQL engines (Snowflake, Databricks, Trino), once a single SQL statement involves more than 10 tables, 10 CTEs, many predicates + join + group by + window function(s), it is very difficult for the cost-based optimizier to figure the right/optimal plan. An effective mitigation is to refactor a “sub graph”, which consists of a few CTEs, into a persisted table, so that CBO can figure out the cardinality of join/group_by keys and predicate the proper tradeoffs. This type of refactor should always be coupled with the effort of “reusable” tables and highly-popular MVs.
SQL Best Practice
- First and foremost, full reprocess (drop-and-recreate-from-scratch) every daily/batch is the worst SQL pattern which represent “easy-to-write-but-expensive-to-execute”. Using incremental template and create incremental framework is the most important design pattern to enforce. However, this is is still the most obvious tech debt that developers and analysts don’t want to tackle. Therefore AI tool and organizational change are required here.
- Writing good filter/predicate(s) is often not fully understood. Here are some DOs and DON’Ts:
- Don’t apply complex transformation function to the partition/cluster column, for example,
WHERE TO_TIMESTAMP(epoch_num_col, 3) >= CURRENT_DATE() - 1is bad.
WHERE epoch_num_col >= DATE_PART(epoch_millisecond, CURRENT_DATE()-1)is good - Extra redundant conditions are also important, for example,
SELECT ... FROM FOO t1 JOIN BAR t2 ON t1.jkey = t2.jkey AND t1.timestamp_col between (x, y)
AND t2.timestamp_col between (x - 14 days, y + 1 day)the time filter againstt2is extra and approximate here but it can effectively reduce the scan oft2 - Be very careful of
ORoperator because it often leads to join explosion and cartesian join.Non-equi Joinis ususally slow in Snowflake, see this explanation and ASOF JOIN please. Both are trading complexity for speed.
- Don’t apply complex transformation function to the partition/cluster column, for example,
- Profiling the data content to understand data skewness is the essential mechanism to isolate the “celebrities” from the reset. Snowflake CBO still can’t figure this out in most cases.
COUNT(DISTINCT x)and window functions are much more expensive than we can possibly imagine. We can tryHLL(x),MAX(RIGHT(LPAD(qty, 12, '0'), 12) || TO_CHAR(ts, 'YYYYMMDDHH24MISSFF3') || payload_col), orMAX_BY(payload_col, ROW(qty, ts))to evaluate the difference.- Snowflake (and Databricks) does not yet have row-level index and single-row DML is super expensive.
Please don’t port MySQL/Postgres style lookup and DML to Snowflake, and then loop such a statement
many times.
- 10K
SELECT a, b, c FROM T WHERE id = ?queries in a minute is much worse than putting all 10K IDs into a parameter tableXfirst and thenSELECT a, b, c FROM T WHERE id IN (SELECT id FROM X WHERE request_id = ?). X may contain multiple sets of IDs separated by the application-levelrequest_id. - UPDATE/MERGE/DELETE 10K records one-by-one via a loop in Java/Python/Go is very bad for Snowflake. We should first buffer them into a Parquet file, then refer to it as an external table to perform DML with a subquery
rows_producedandbytes_writtenin QUERY_HISTORY can actually illustrate the astonishing overhead of write amplification in the Copy-on-Write mode.
The Gen2 (Merge-on-Read) mode shows lessrows_producedyet has similarexecution_time. We have to carefully evaluate if Gen2 can visibly make MERGE/UPDATE/DELETE faster.
- 10K
- In addition to (5), other OLTP query shapes are all very bad for Snowflake and Databricks, but most AI
models and MCPs don’t refrain from firing frequent and narrow needle-in-haystack queries against an OLAP
engine. Row-by-row looping, nested loop instead of hash batch join, many concurrent lookups with Full
Table Scan, … these activities can quickly overwhelm the virtual warehouse and create a long queue.
Even if we triple the number of clusters for the warehouse, the bad queries can quickly saturate the I/O
again. This is yet another popular abuse of Snowflake and it leads to a lot of cost spikes especially in
the AI era.
https://www.onehouse.ai/blog/announcing-onehouse-lakebase-database-speeds-finally-on-the-lakehouse - Iceberg supports expressive partitioning-on-the-write, this can be quite useful to locate the
records for the next steps of a pipeline when
WHERE partition_col = ?can be used multiple times with different values. This “immediate/write-time” partitioning is not possible in a FDN table.
When data volume is huge, all these tips and tricks can greatly improve the query/pipeline performance. But any code change requires data parity verification and migration coordination, we need to a framework to relieve human from such labor-intensive exercises.
Linter and Compile-time Check
The counter part of best practice is anti-pattern. Some teams try to follow the traditional software enginnering way to detect “bad” SQLs via linter or AI review during local test or CI time. But this approach yields tiny effect unless the “bad” pattern is extremely specific or obvious. In the Snowflake/Databricks/Trino domain, we don’t have index (unless Hybrid Table is involved) and not each query has to use clustering key. Unlike the microservice codes, the data volume (before and after FILTER and JOIN is applied) matters a lot. To reasonably estimate the data volume is a pretty diificult task for CBO already, so linter and isolated AI (w/o comprehensive data distribution knowledge) will just identify way too many “bad” queries, yet 80% of them may run fine in production because the actual data volume is not big enough to cause any problem. For example, if a job runs for 3 minutes instead of 20 seconds due to the so-called “bad” pattern, the 9X performance difference does NOT have a visible impact on the warehouse-level cost. Raising too many warnings and alerts during PR review will quickly become a fatigue - either developers will, in general, ignore the AI warnings; or exceptions ought to be added to ignore. This is actually a misuse of AI and the SQL best practice rules (unless we can concrete evidence to convince human that this query is bad enough, or AI can automatically refactor and conduct the data parity verfication).
Yes, we can and should write a bunch of table-specific SKILL.md files. But the evolution of such files must be handled by agents themselves (not by humans).
That’s why, when it comes to SQL performance evaluation and bad pattern detection, even sample data or test database is pretty much useless. The 2 must-have are: [1] query profile with the read production grade data volume [2] comprehensive data distribution stats based on various filter and join fields.
In another word, just knowing the schemas and a few certified sample queries is still far from sufficient in order to rewrite/refactor the queries for much better performance. Allowing a NEW bad query to run once or a couple of times in production never breaks the bank (as long as we don’t use the default query timeout), 99% of the real problem is that we don’t know how (or want) to refactor those suboptimal jobs and wasteful backfills which already have very concrete query profiles to show why they are so bad but still scheduled everyday.
Before we seriously dedicate resources and priorities to those existing bad jobs, we should probably downplay the unrealistic expectations for compile-time linter and AI check.
4. Migrate to Other Engines
Once we identified the most expensive workloads and tried some nifty SQL patterns, yet the impact is still minimal or the SQL becomes hard to maintain, this is the time to seriously try different engines. We call this “Right Tool for the Job”.
There is no single “Holy Grail” here, but we have to try other options, for example:
- Spark Declarative Pipelines gives developers more control;
- DuckDB excels in workloads with a medium data volume (<2TB as of now) on a single EC2 w/o competing neighbors;
- Feldera offers comprehensive incremental semantics and guardrails;
- Dask, Polars, Bauplan wrap Arrow + DataFusion into Python;
- BigQuery, e6data, Databend, …
Since we ONLY need to migrate a small % of workloads from Snowflake to the “right” engine, this can deliver the decent ROI w/o boiling the ocean. Once the new production jobs prove their value and stability, more workloads with the matching pattern can be migrated gradually.
Iceberg is making this “single storage for/with multiple compute engines” possible. There are still some caveats and blocks for the full interoperability across catalogs and engines, but this direction is irreversible.
5. Storage Cost Reduction
Asking developers to identify and delete the cloned and no-longer-used tables is impossible, we have to build a service to identify such objects based on naming convention and metadata (lineage history), then perform the clean up in the background.
Typically, we can get 15~30% S3 discount from AWS, but Snowflake charges us $23/TB per month. So for the huge tables and backups/clones, it is economically wise to go with Iceberg. Adopting quarterly or monthly tables with an umbrella UNION ALL view can make this more measuable and manageable.
In the future, we will see a few highly-optimized service (outside Snowflake) to ingest, schematizate, and compact + sort Iceberg tables arguably more efficient than Snowflake, and even generate Puffin index or sync metadata to Delta format or … then we will have more incentive to embrace the multi-engine archiecture while cutting 30% storage cost.
Summary
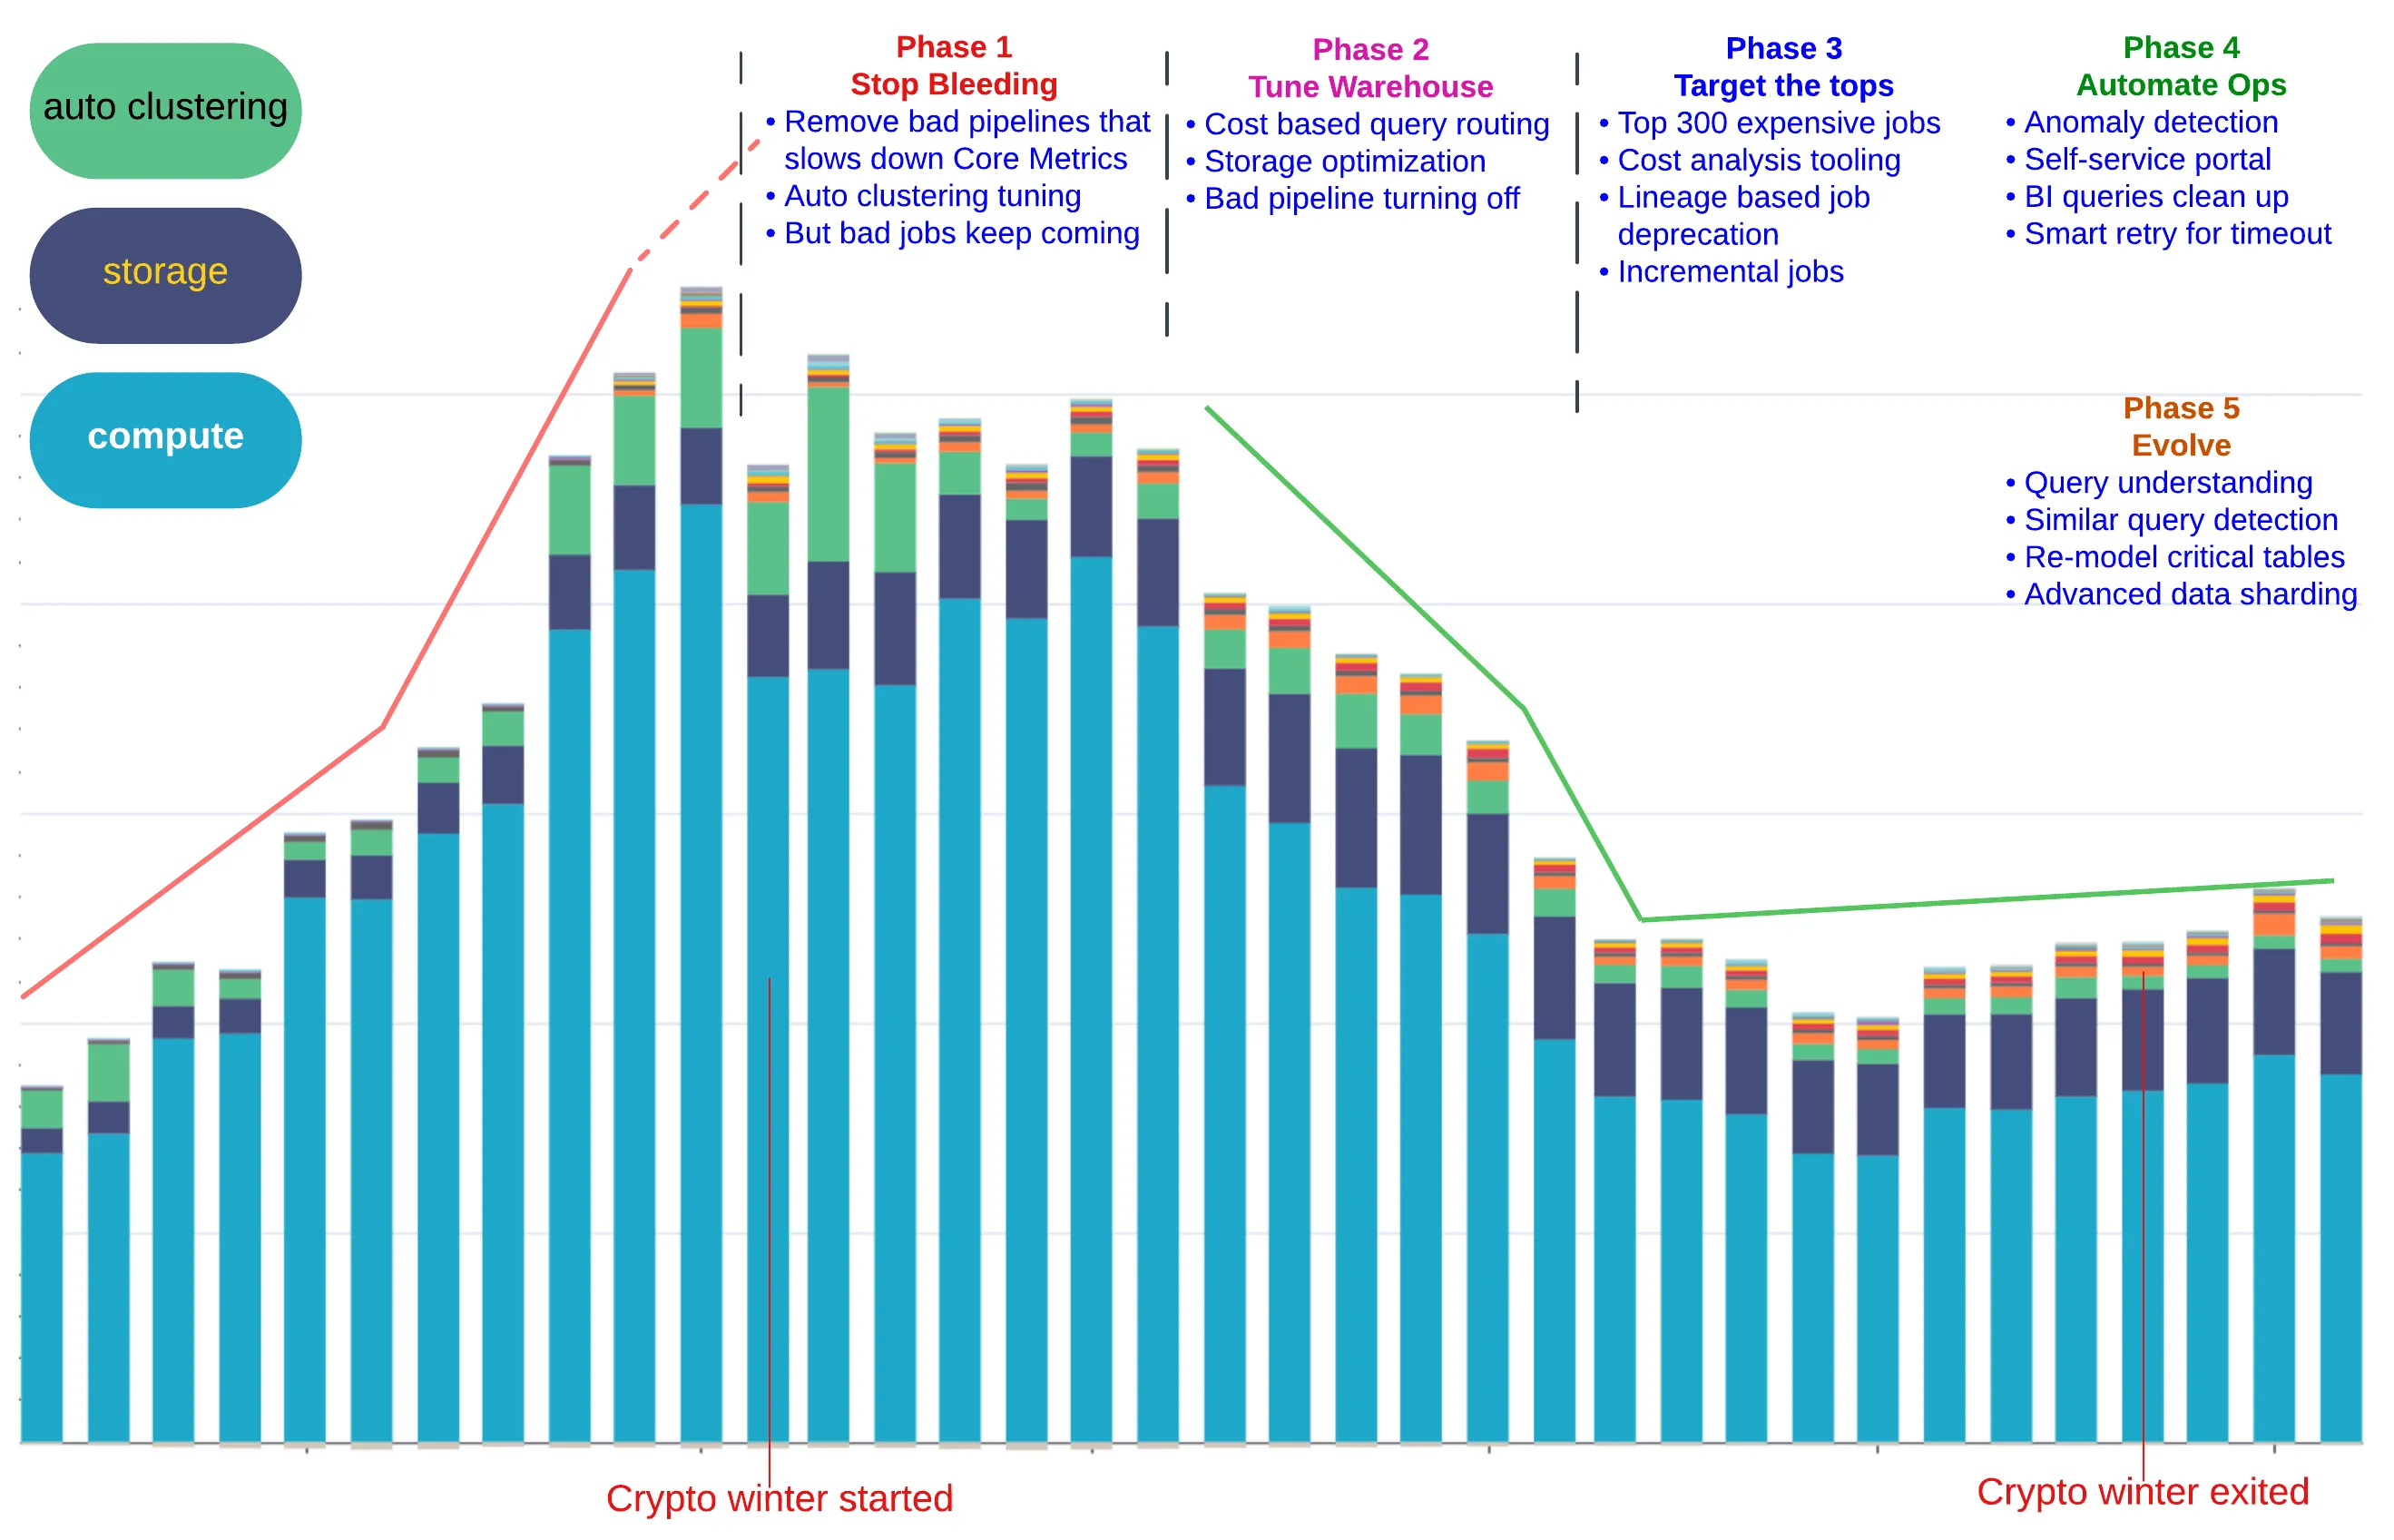
Here is a timeline of the implementation sequence and real effect of the above strategy.
A Few Takeaways:
- Easy-to-Write-Yet-Expensive-to-Execute SQL workloads may (and will) get out of control
- Propagating higher-level business/flow context into QUERY_TAG is a Must-Have
- Analytics of the key signals: warehouse_size, execution_time, and bytes_spilled; Make the most Insights out of Query Profiles & History
- Most batch jobs are relatively Stable, so assign the queries to the properly-sized Warehouse(s) and Avoid keeping the XL+ Warehouse up for too long
- Costly workloads are Highly Skewed: the top 5% expensive jobs/queries contribute to ~40% of total costs —>> Don’t spread the Optimization Effort Evenly and Don’t bother tackling the Long Tail
- One-size-does-NOT-fit-all: Special workloads require processing engines and storage layout which are customized accordingly. The developer community still needs other advanced skills beyond SQL
AI can definitely accelerate the optimization journey, but we have to build an effective lineage
to understand the cost attribution with a meaningful business & organization hierarchy first.
Once we identify the warehouses, jobs, backfills, dashboards which burn the costs the most, we can
apply the above optimization techniques. This is not a one-time diet or keto, but rather a
continuous endeavor of data modeling + SQL craftsmanship. If developers don’t master the skills, they
will quickly be replaced by AI which can analyze the query profiles and data profiles, apply the
rules specified in SKILL.md, iterate on data quality at table/subset/record level, and pursue
the opportunity to merge similar subquery/CTE logic into a reusable View and Materialized View.
- https://www.definite.app/blog/duckdb-datawarehouse
- e6data promises to improve orchestration efficiency for compute
- https://www.e6data.com/query-and-cost-optimization-hub/snowflake-query-optimization
- https://www.bauplanlabs.com/
- https://www.snowflake.com/en/developers/guides/well-architected-framework-cost-optimization-and-finops/
- How Coinbase Boosted Cost Efficiency with Snowflake During the “Crypto Winter”